The difference between a product that ships and one that doesn't? A validated strategy before a single line of code is written. This guide shows you exactly how we do it — with real examples from projects we've delivered.
Inside this guide, you'll find real SOWs, discovery interview scripts, FigJam research boards, branded delivery documents, and ClickUp project structures — all from actual Varritech engagements.
Phase 1: Research & Discovery — Before You Write a Single Line of Code
Phase 1 · Research & discovery
The FigJam board becomes a one-page brief
2-hour founder workshop · loops ~18s
Personas
User journeys
Competitive landscape
Technical constraints
Feature map
Open questions
Synthesize · 48h later
One-page brief
Crisp problem statement
Target user
Top 5 features
→ the seed of your PRD
Six zones fill in the workshop; the board is the working document. Distilled, it becomes the brief every later phase traces back to.
Every project at Varritech begins with a structured discovery phase. We use FigJam as our collaborative research canvas — mapping user journeys, competitive landscapes, feature prioritization, and technical constraints before committing to a single design or line of code.
Case Study: PortableTenant — Tenant Screening Platform
PortableTenant is a tenant screening platform that enables renters to maintain a single, reusable screening report. When we kicked off this engagement, we needed to understand a complex multi-sided marketplace: renters, landlords, and integration partners.
🗺️
FigJam Research Board — What We Mapped: • User journey maps for 3 personas (renter, landlord, partner developer) • Competitive analysis matrix: TransUnion SmartMove, Experian RentBureau, Avail, Zillow Rental Manager • Revenue model canvas: tenant fees, partner affiliate commissions (20%), yearly partner subscriptions • Technical constraint mapping: data portability requirements, multi-partner sharing, compliance (FCRA, GDPR) • Feature prioritization using MoSCoW: 12 Must-haves, 8 Should-haves, 5 Could-haves • Integration architecture diagram: REST API, embeddable widgets, webhook events
👆 Open the PortableTenant Competitive Benchmark FigJam board — Includes competitive benchmark of LeaseRunner, Zillow Rentals, and Experian; user stories for tenants and landlords; onboarding flow analysis; and UX annotations across 129 research elements.
Key insight from discovery: The biggest risk wasn't technical — it was that both renters AND landlords needed agreements with PortableTenant for the platform to work. This two-sided adoption challenge shaped our entire go-to-market strategy and phased rollout plan.
Case Study: TutorAssist AI — Gamified Learning Platform
TutorAssist AI is a gamified learning platform that combines AI tutoring with personalized feedback to keep students motivated and challenged. Discovery was critical because education technology has diverse user needs — from K-12 students to adult learners — and the AI features needed to adapt to different learning styles, knowledge levels, and curriculum standards.
🗺️
FigJam Research Board — What We Mapped: • Learner persona spectrum: K-12 students (guided learning), college students (self-paced), adult learners (skill-building), educators (content creation & monitoring) • Competitive teardown: Duolingo, Khan Academy, Quizlet, Photomath — mapped strengths/weaknesses across engagement, AI quality, gamification, and content depth • AI use cases: Ace AI companion for contextual tutoring, adaptive difficulty, personalized feedback, learning path generation • Infrastructure decisions: React Native (Expo) for cross-platform mobile, Express.js backend, NativeWind/Tailwind for design system • Gamification model: XP/leveling system, achievement badges, daily challenges, leaderboards, streak tracking • Monetization model: freemium with IAP (Apple + Google), premium AI features and advanced analytics as subscription
Key insight from discovery: Students and parents are overwhelmed by generic learning apps that don't adapt. The number one feature request wasn't more content — it was an AI companion that truly understands where the student is struggling. We designed Ace, a contextual AI tutor that provides real-time hints, personalized explanations, and adaptive difficulty — turning passive content consumption into active, guided learning. The gamification layer (XP, badges, leaderboards) was the retention mechanism, but AI-driven personalization was the core value proposition.
How to Run Your Own FigJam Discovery Session
Create a fresh FigJam board with 6 sections: Personas, User Journeys, Competitive Landscape, Technical Constraints, Feature Map, Open Questions
Run a 2-hour founder workshop — The founder/product owner fills in Personas and User Journeys while the tech lead maps Technical Constraints. Everyone contributes to Feature Map.
Competitive analysis sprint (48 hours) — Sign up for every competitor. Screenshot their flows. Map their pricing. Identify the gap your product fills.
Synthesize into a 1-page brief — The FigJam board is your working document. Distill it into a crisp problem statement, target user, and top 5 features. This becomes the seed of your PRD.
🎧
🎧 Audio Guide: Phase 1 Deep Dive Listen to a detailed walkthrough of the Research & Discovery phase — covering competitive analysis frameworks, user persona development, and FigJam discovery techniques.
Reusable screening reportBUILD FIRSTR 2,000 · I 3 · C 80% · E 31,600
Gut-feel order in, evidence order out. Score every feature on four dimensions and the backlog sorts itself — highest score builds first.
Before diving into research, you need the right frameworks to structure your thinking. Here are the battle-tested frameworks we use at every stage of discovery.
RICE Scoring Framework
RICE (Reach, Impact, Confidence, Effort) is the gold standard for feature prioritization. Developed by Intercom's product team, it eliminates gut-feel decisions by scoring every feature on four dimensions.
Reach — How many users will this affect per quarter? (e.g., 500 users/quarter)
Impact — How much will it move the needle? Score: 3 = massive, 2 = high, 1 = medium, 0.5 = low, 0.25 = minimal
Confidence — How sure are you about estimates? 100% = high, 80% = medium, 50% = low
Effort — Person-months of work required (e.g., 2 person-months)
Formula: RICE Score = (Reach × Impact × Confidence) / Effort. Features with the highest scores get built first.
Created by Clayton Christensen (Harvard Business School), JTBD reframes product thinking from "what features do users want?" to "what job is the user hiring this product to do?" This is the single most powerful lens for discovery interviews.
Core question: "When you [situation], you want to [motivation] so you can [expected outcome]"
Four Forces of Progress: Push (current pain), Pull (new solution appeal), Anxiety (fear of change), Habit (comfort with status quo)
Switch Interview: Ask about the last time someone switched from a competitor — what triggered the switch? What almost stopped them?
The Kano Model (developed by Professor Noriaki Kano) classifies features into 5 categories based on how they affect customer satisfaction. It prevents the common mistake of building features that users expect but won't pay for.
Must-Be (Basic) — Expected features. Their absence causes dissatisfaction, but their presence doesn't increase satisfaction. (e.g., a login page)
One-Dimensional (Performance) — More is better. Satisfaction scales linearly with implementation. (e.g., page load speed)
Attractive (Delighters) — Unexpected features that create disproportionate satisfaction. These are your competitive moat. (e.g., Superhuman's "Undo Send" countdown)
Indifferent — Users don't care either way. Stop building these.
Reverse — Features that actively drive users away. (e.g., forced onboarding tutorials)
Competitive Analysis — Porter's Five Forces + Perceptual Maps
Don't just list competitors. Use structured frameworks to understand your competitive landscape and find positioning gaps.
Porter's Five Forces: Analyze (1) competitive rivalry, (2) supplier power, (3) buyer power, (4) threat of substitution, (5) threat of new entry. This reveals whether your market is worth entering.
Perceptual Maps: Plot competitors on two axes (e.g., price vs. complexity, or enterprise vs. consumer). Find the empty quadrant — that's your opportunity.
SWOT Analysis: Strengths, Weaknesses, Opportunities, Threats. Simple but effective when done honestly. The key is being brutally honest about weaknesses.
Ash Maurya's adaptation of Business Model Canvas, specifically designed for startups. Complete it in under 20 minutes. If you can't fill a box, that's a signal you need more discovery.
Pro tip: Create one Lean Canvas per customer segment. A B2B SaaS product serving both SMBs and enterprises needs two separate canvases — the problems, channels, and pricing are fundamentally different.
Market Sizing — TAM, SAM, SOM
Every investor deck and product strategy needs market sizing. Use the bottom-up approach (more credible than top-down) to calculate your addressable market.
TAM (Total Addressable Market) — Total revenue if you captured 100% of the market. e.g., "The global tenant screening market is $4.2B"
SAM (Serviceable Available Market) — The segment you can realistically reach. e.g., "US independent landlords = $1.1B"
SOM (Serviceable Obtainable Market) — What you can capture in 2-3 years. e.g., "5% of US indie landlords = $55M"
Go beyond demographics. Build behavioral personas that capture goals, frustrations, and decision-making patterns. Each persona should feel like a real person you've interviewed.
An MVP is not a crappy v1. It's the smallest experiment that validates your riskiest assumption. Get this wrong and you'll waste months building something nobody wants.
Concierge MVP: Manually deliver the service before automating. Zappos started by buying shoes from stores and shipping them.
Wizard of Oz MVP: Users see a product interface, but humans perform the work behind the scenes.
Single-Feature MVP: Build one feature exceptionally well. Linear launched with only task management — no roadmaps, no docs, no wikis.
Landing Page MVP: Validate demand before writing code. Buffer got 100K signups with just a landing page describing the product.
Phase 2: The Discovery Interview — A Script That Actually Works
Phase 2 · The discovery interview
45 minutes, four blocks — not a sales call
REC · with permission
Q"Describe your product in one sentence — as if to a stranger at a coffee shop."
Q"What exact words did potential users use to describe their pain?"
Q"Walk me through the core flow — first touch to the 'aha' moment."
Q"What would make this engagement a failure? And what's a home run?"
raw transcript→PRD template
THE VISION
THE MARKET
TECHNICAL REALITY
CONSTRAINTS
10 min10 min15 min10 min
The client's exact language is the deliverable — it becomes user stories, marketing copy, and success metrics, fed straight into the PRD.
Before we scope a single feature, we run a structured discovery interview with every prospective client. This isn't a sales call — it's a technical deep-dive designed to surface hidden complexity, misaligned expectations, and the real problem behind the stated request.
🎙️
Varritech Discovery Interview Script (45-60 minutes) We use this exact script with every new client engagement.
Block 1: The Vision (10 min)
"Describe your product in one sentence as if explaining it to a stranger at a coffee shop."
"Who is the primary user? Paint me a picture of their day — what frustrates them right now?"
"If this product is wildly successful in 12 months, what does that look like? Revenue? Users? Impact?"
"What happens if you don't build this? What's the cost of doing nothing?"
Block 2: The Market (10 min)
"Who are your top 3 competitors? What do they do well? What do they get wrong?"
"Have you talked to potential users? What exact words did they use to describe their pain?"
"What's your go-to-market strategy? How will the first 100 users find you?"
"What's your pricing model? How did you arrive at that number?"
Block 3: The Technical Reality (15 min)
"Walk me through the core user flow — step by step, what does the user do from first touch to 'aha' moment?"
"Are there any third-party integrations required? Payment processors? APIs? Data sources?"
"What are the compliance or regulatory requirements? HIPAA? GDPR? PCI-DSS? SOC 2?"
"Do you have existing code, designs, or documentation? Or are we starting from zero?"
"What platforms? Web only? iOS? Android? All three?"
Block 4: Constraints & Expectations (10 min)
"What's your budget range? This helps us scope appropriately — MVP vs full platform."
"Is there a hard deadline? A launch event, investor demo, or seasonal window?"
"What does your team look like? Who will be our day-to-day contact? Who makes final decisions?"
"What's the one thing that would make you say 'this engagement was a failure'? And what would make it a home run?"
Pro tip: Record the interview (with permission). The exact language the client uses becomes the foundation for user stories, marketing copy, and success metrics. We take raw transcripts and feed them into our PRD template.
🎧
🎧 Audio Guide: Discovery Interview Deep Dive Listen to a walkthrough of the 4-block discovery interview script — including specific questions, follow-up prompts, and how to read between the lines of client responses.
Phase 3: Software Requirements Specification — The Engineering Blueprint
Phase 3 · Software requirements specification
Eight sections, full traceability
IEEE 830 · evolved over 20+ engagements · loops ~16s
The SOW says what and when; the SRS says exactly how the system behaves. It prevents the "I thought you were using Firebase" moment.
The SRS is the engineering contract between stakeholders and the development team. It transforms discovery insights into precise functional requirements, system behaviors, technical constraints, and acceptance criteria. Where an SOW defines what you'll deliver and when, the SRS defines exactly how the system must behave — down to every edge case, error state, and integration point. Here's a walkthrough of a real Varritech SRS built for a platform.
📄
Real SRS: PortableTenant Integration Platform Document: Software Requirements Specification v1.0 Status: Approved | Format: IEEE 830 / Varritech SRS Template View the SRS template we use →
SRS Structure (Our Template)
Every Varritech SRS follows an 8-section structure based on IEEE 830, adapted for modern product development. It's evolved over 20+ engagements and eliminates ambiguity before a single line of code is written:
Executive Summary & Introduction — Project context, purpose, scope, and stakeholder alignment. For PortableTenant: "a tenant screening platform enabling renters to maintain a single, reusable screening report" with clearly defined in-scope vs. out-of-scope boundaries, definitions, acronyms, and document references.
Overall Description — Product perspective, system context diagrams, product functions, user classes and characteristics, operating environment, design constraints, and assumptions. PortableTenant's section mapped three user classes (renter, landlord, partner developer), hardware/software dependencies, and the two-sided marketplace constraint.
Specific Requirements — The core of the SRS. Functional requirements organized by feature area (user management, screening reports, landlord portal, affiliate tracking), non-functional requirements (performance, security, usability, reliability, scalability), external interface requirements, detailed system features with stimulus/response sequences, data requirements with entity schemas, UI specifications, and complete user stories with acceptance criteria.
Project & Business Considerations — Expected budget breakdown (development + operational costs), development timeline with phased milestones, success metrics (technical KPIs, business KPIs, user engagement), risk analysis (technical, business, market), competitive analysis, and marketing/analytics requirements.
Technical Specifications — Architecture overview with system diagrams, complete technology stack decisions, API specifications with design principles and rate limiting, database schema with core table designs, and security architecture covering authentication flows and security measures. This section prevents 'I thought you were using Firebase' moments.
Testing Requirements — Test strategy with testing levels (unit, integration, e2e, performance), test environments, feature-level acceptance criteria for every requirement, user acceptance testing protocols, and performance benchmarks with specific targets for application response times, API latency, and load testing.
Deployment & Maintenance + Appendices — Deployment strategy with release processes, support tiers and SLAs, update strategy with monitoring/maintenance plans, documentation deliverables. Appendices include visual references (screen flow diagrams, key mockups), glossary, and revision history. Every requirement traces back to a user story, and every user story traces to a test case.
📚
SRS Library: We've built Software Requirements Specifications across every vertical — AI Telehealth, Fleet Management, Payment Platforms, AI Crowdfunding, CRM Systems, Knowledge Bases, and Mobile Apps. Each follows the same 8-section IEEE 830 template adapted for the project's complexity. The SRS becomes the single source of truth that developers, QA, and stakeholders all reference throughout the build.
Phase 4: Branded Delivery Documents — How to Show, Not Tell
Phase 4 · Branded delivery documents
Show, don't tell — every deliverable gets the brand pass
One doc every ~4s · four types
Produced · Canva + Notion
Brand pass — cover banner
Delivered to client
WEEKLY STATUS DECKVIDEO PROOF DOCTECHNICAL DELIVERY DOCSOW COVER BANNER
Clients buy confidence, not just software. Status decks, video proof, technical delivery docs, and SOW banners — branded, documented, and something they can show their stakeholders.
Clients don't just want working software — they want confidence that the process is professional and documented. Branded delivery documents build trust, create a paper trail, and give clients something tangible to show their stakeholders.
Document Types We Deliver
📋
1. Weekly Status Reports (Canva + Notion) Branded slide decks showing sprint progress, blockers, demos. We maintain Canva templates for every active project — PortableTenant, Thunder, and Ffreya each have their own weekly status deck series (6-9 pages each).
2. Video Proof & Feature Delivery Docs (Notion) For Thunder, we created a Video Proof & Feature Delivery Documentation page with screen recordings of every delivered feature. Each entry includes: feature name, video walkthrough, acceptance criteria met, and any known limitations.
3. Technical Delivery Documents (Notion) The Apple IAP Integration document for PilotLogAi is a detailed technical delivery doc covering implementation details, edge cases handled, testing procedures, and deployment instructions.
4. SOW Cover Banners (Custom-Generated) Every SOW and delivery document gets a custom Varritech-branded banner — dark theme, purple gradients, lime accents, hex grid patterns. Generated via HTML/CSS + Playwright, permanently hosted.
Phase 5: Project Structure in ClickUp — The PM's Blueprint
Phase 5 · Project structure in ClickUp
From contract to code — one traceability chain
PortableTenant: 160+ tasks run this way · loops ~15s
SOWmilestone
EPICper milestone
STORYper deliverable
TASKsprint-sized
PRcode review
DEPLOYshipped
…and every task walks the sprint statuses ↓
TO DO
IN PROGRESS
IN REVIEW
QA
DONE
✓
Every SOW milestone becomes an Epic, every deliverable a Story. Completed sprints become an immutable record of what was delivered.
Project management tooling is only as good as its structure. A messy ClickUp workspace leads to lost tasks, missed deadlines, and confused team members. Here's exactly how we structure every project at Varritech — with a real example from PortableTenant.
Workspace Architecture
We run a single ClickUp workspace ("Varritech Development Services") with 23 active project Spaces — one per client/product. This keeps permissions, statuses, and workflows isolated while maintaining a bird's-eye view across all projects.
📁 Support Sprints (81 tasks) 📋 February 6th - March 6th — 81 active support tasks
📋 Mktg: Portable Tenant — 39 marketing tasks 📋 Client Requested Bugs/Enhancements — 72 items 📋 [PR-PT] Epics (based on SOW) — 5 epics 📋 [PR-PT] Story (based on SOW) — 36 user stories
Key PM Patterns We Use
SOW-Driven Epics and Stories — Every SOW milestone becomes an Epic. Every deliverable within a milestone becomes a Story. Stories break down into Tasks. This creates a direct traceability chain from contract to code: SOW Milestone → Epic → Story → Task → PR → Deployment.
Time-Boxed Sprint Lists — Each sprint is a separate List within the Sprint Folder, named with date ranges (e.g., "Sprint 1 (9/1 - 9/7)"). Tasks are pulled from the Backlog into the current sprint during planning. Completed sprints become an immutable record of what was delivered.
Separate Support Track — Bug reports and client-requested enhancements live in dedicated folderless lists, not in the sprint workflow. This prevents support work from derailing planned feature development. PMs triage support items weekly and promote critical ones into the next sprint.
Marketing as a Parallel Track — Marketing tasks (content creation, ad campaigns, social media) run in their own folderless list within the same Space. This gives the PM visibility into the full product lifecycle — not just engineering.
Custom Statuses Per Workflow — Sprint folders use override statuses: To Do → In Progress → In Review → QA → Done. Support lists use: New → Triaged → Scheduled → Fixed → Verified. Marketing uses: Ideation → Draft → Review → Published.
PilotLogAi: A Leaner Structure
Not every project needs the same complexity. PilotLogAi uses a simpler structure suited to its smaller team and shorter sprint cycles:
Simpler structure because: smaller team (2 devs), shorter engagement, clear scope from day one. No separate support track needed — bugs go straight into the next sprint.
The lesson: Your project management structure should match your project's complexity. Don't over-engineer a simple project, and don't under-engineer a complex one. Start with the minimal viable structure and add complexity only when it solves a real coordination problem.
How to Set Up Your Own ClickUp Space (Step by Step)
Create a Space named after the project/client
Create a "Sprint Folder" with custom statuses: To Do → In Progress → In Review → QA → Done
Create a "Backlog" list inside the Sprint Folder for unprioritized work
Create folderless lists: "Client Bugs/Enhancements" and "Epics (SOW-based)"
Add team members with appropriate roles (Admin, Member, Guest for client)
Set up automations: assign sprint tasks on status change, notify Slack on blockers
Create sprint list templates so new sprints take 30 seconds to set up
Connect ClickUp to Slack channel for real-time task notifications
Bonus: Product-Market Fit Validation
Bonus · Product-market fit validation
PMF is measurable, not a feeling
Two signals, one verdict · loops ~14s
Signal 1 — the Sean Ellis test
"How would you feel if you could no longer use the product?"
Very disappointed40%43%
Somewhat31%
Not disappointed26%
43% ≥ 40% benchmark → PMF signal
Signal 2 — cohort retention over 12 weeks
flattens ≈ 40% → strong PMFdecays to zero → keep iterating
Survey 40+ active users; track cohorts 8–12 weeks. 40%+ "very disappointed" and a flattening curve — below 25%, pivot or iterate.
Product-market fit isn't a feeling — it's measurable. Here are the frameworks and benchmarks used by the world's best product teams to validate PMF before scaling.
The Sean Ellis Test (40% Benchmark)
Sean Ellis (founder of GrowthHackers) created the simplest PMF test: survey your users with one question — "How would you feel if you could no longer use [product]?" If 40%+ answer "Very Disappointed," you have product-market fit.
Survey question: "How would you feel if you could no longer use [product]?" Options: Very Disappointed, Somewhat Disappointed, Not Disappointed
If your retention curve flattens (doesn't go to zero), you have PMF. If it asymptotes at 20%+ monthly retention, you have strong PMF. Track cohort retention over 8-12 weeks.
Good SaaS retention: 90%+ monthly for B2B, 40%+ for B2C apps
Strategy without execution is a dream. Go-to-market is where strategy meets reality. These frameworks help you launch with clarity.
April Dunford's Obviously Awesome Positioning
April Dunford's positioning framework has 5 components. Get these right and your messaging writes itself. Get them wrong and no amount of marketing budget will save you.
Competitive Alternatives — What would customers use if your product didn't exist? (Not just direct competitors — include spreadsheets, manual processes, doing nothing)
Unique Attributes — What features/capabilities do you have that alternatives don't?
Value — What value do those unique attributes enable for customers?
Target Customer — Who cares the MOST about that value? (Not "everyone")
Market Category — What context makes your value obvious? (e.g., "CRM" vs "sales acceleration platform")
OST is a visual framework that connects business outcomes to customer opportunities to solutions. It prevents the common trap of jumping straight to features without understanding the problem space.
🎧 Audio Guide: Strategy Frameworks Deep Dive Listen to a walkthrough of RICE scoring, Jobs-to-Be-Done, the Sean Ellis PMF test, Opportunity Solution Trees, and April Dunford's positioning framework.
Bonus: Product Metrics That Matter
Bonus · Product metrics that matter
The pirate funnel — and the one metric above it
AARRR · Dave McClure · loops ~14s
ACQUISITIONchannels · CAC10,000visitors
ACTIVATIONonboarding · time-to-value6,200reach the "aha"
RETENTIONDAU/MAU · cohorts4,000come back — the PMF signal
REVENUEARPU · LTV2,200pay
REFERRALNPS · viral coefficient1,200tell others
✦Above the funnel sits ONE North Star — the value metric revenue follows.
Each stage has its own metric set — but teams that track everything improve nothing. Pick the North Star first; the funnel explains it.
You can't improve what you don't measure. Here are the metric frameworks that separate data-informed teams from data-drowning ones.
North Star Metric
Every product needs ONE metric that captures the core value you deliver to users. This is not revenue — it's the leading indicator that revenue follows.
Airbnb: Nights booked (not revenue, not signups)
Spotify: Time spent listening (not subscribers)
Slack: Messages sent in channels (not DAUs)
PortableTenant: Screening reports delivered to landlords
80% of startups fail building the wrong thing. Market sizing, competitors, ICPs, feature scores, roadmap, unit economics — stress-tested before a dollar goes to development.
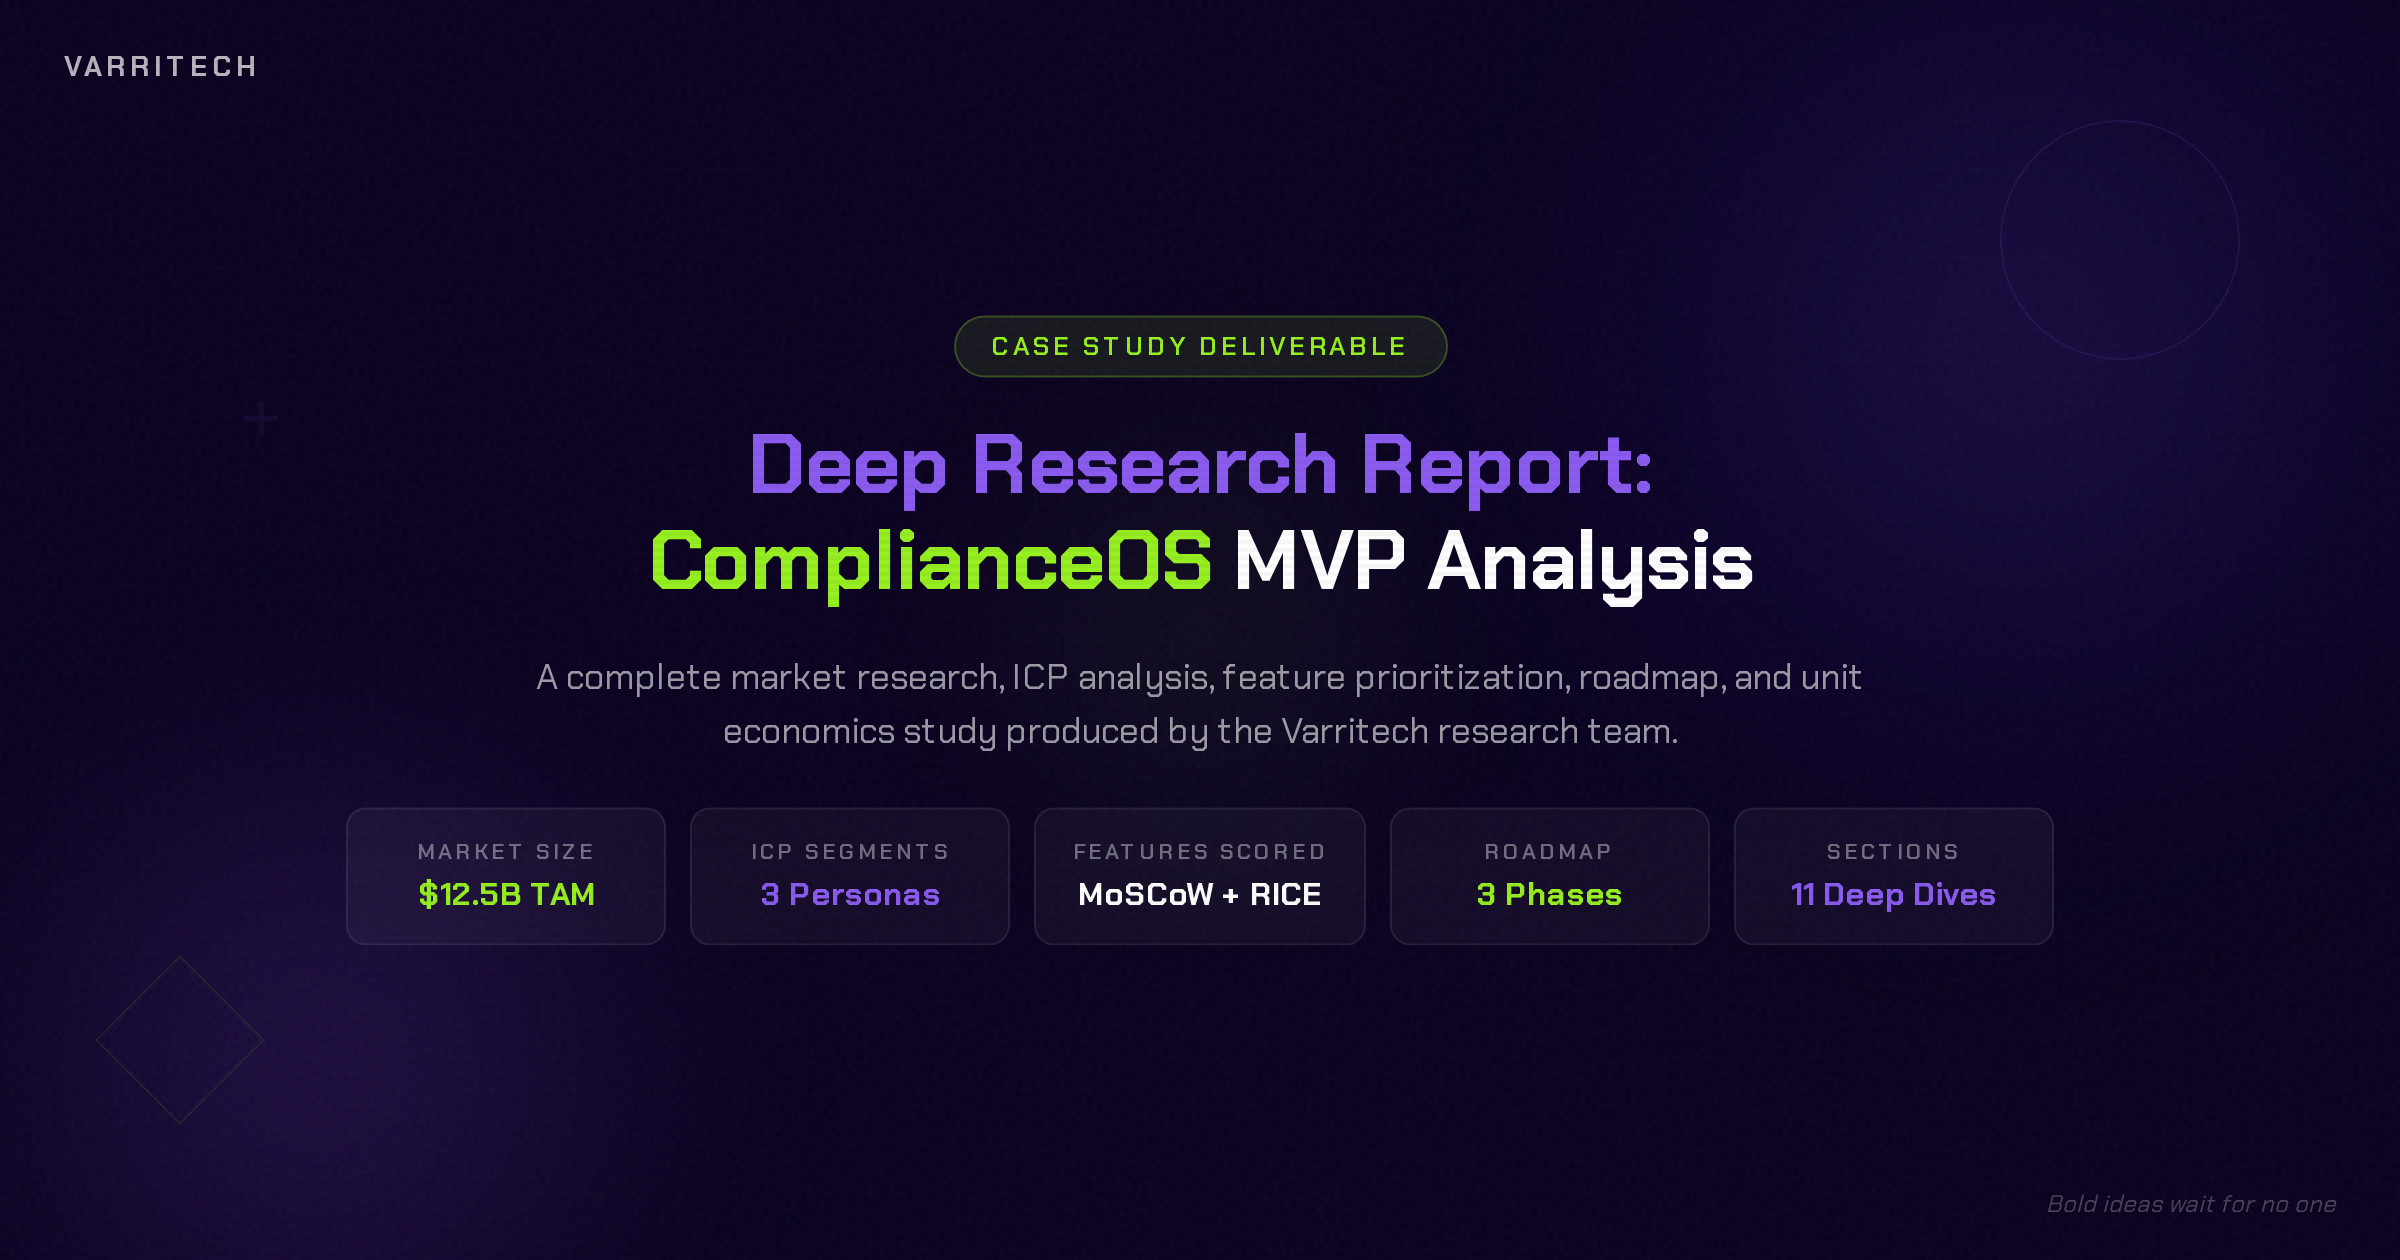
Before a single wireframe is drawn or a line of code is written, Varritech's research team produces a Deep Research Report that stress-tests the entire product hypothesis. This isn't a surface-level overview. It's a structured, data-driven investigation that covers market sizing, competitive landscape, ideal customer profiles, feature prioritization, technical architecture, unit economics, and risk analysis.
The goal is simple: de-risk the build before the build begins. Founders and product teams who skip this step often discover fatal flaws mid-development, burning months of runway on features nobody wants, or entering markets that can't support their price point.
Our Process: From Blank Page to Battle-Tested Report
Every deep research report follows the same rigorous methodology, refined across dozens of MVP engagements:
Phase 1: Market Intelligence — We start with top-down and bottom-up market sizing (TAM/SAM/SOM), regulatory landscape analysis, and macro trend identification. We pull from industry reports, public filings, and primary research to build an honest picture of the opportunity.
Phase 2: Competitive Landscape — We map every direct and indirect competitor across 15+ dimensions: pricing models, feature sets, funding history, customer reviews, market positioning, and technology stacks. We use Porter's Five Forces and perceptual mapping to identify white space.
Phase 3: ICP & Pain Point Analysis — Using Jobs-to-Be-Done and behavioral persona frameworks, we define 2-4 ideal customer profiles with specificity: job titles, company sizes, buying triggers, objection patterns, and willingness-to-pay thresholds.
Phase 4: Feature Prioritization — Every potential feature is scored using MoSCoW (Must/Should/Could/Won't) and RICE (Reach, Impact, Confidence, Effort). This produces a ranked backlog that separates MVP essentials from post-launch enhancements.
Phase 5: Roadmap & Architecture — We design a phased 12-18 month roadmap with clear milestones, technical architecture decisions (build vs. buy, cloud provider, integration points), and resource estimates for each phase.
Phase 6: Unit Economics & Risk — We model customer acquisition cost, lifetime value, payback period, and break-even scenarios. We then run a structured risk analysis covering market, technical, regulatory, and execution risks with mitigation strategies for each.
The entire report is produced in 5-7 business days by a cross-functional team: a product strategist, market researcher, and technical architect working in parallel.
Example Report: ComplianceOS — AI-Powered Compliance Automation for SMBs
To demonstrate the depth and quality of this deliverable, we produced a complete deep research report for ComplianceOS — a fictitious AI-powered compliance automation platform targeting small and mid-size businesses. This is the exact format and level of detail every Varritech client receives.
The ComplianceOS report covers 11 sections across 20+ pages: Executive Summary, Market Overview ($12.5B TAM), Competitive Landscape (12 competitors mapped), Ideal Customer Profiles (3 personas), Pain Point Analysis, Feature Prioritization (MoSCoW + RICE scoring), Phased Roadmap (3 phases over 15 months), Go-to-Market Strategy, Technical Architecture, Unit Economics (with break-even modeling), and Risk Analysis with mitigation matrix.
80% of startups fail because they build the wrong thing, not because they build it badly. A deep research report eliminates the most common failure modes before a single dollar is spent on development:
Market validation — Is the market large enough to support a venture-scale business? Are there regulatory tailwinds or headwinds? What's the realistic serviceable market?
Competitive differentiation — Where is the white space? What do existing solutions get wrong? Is there a defensible wedge?
Feature discipline — Which features are table stakes vs. differentiators? What's the minimum viable feature set that delivers value on day one?
Financial viability — Can this product achieve positive unit economics at realistic scale? What's the payback period on customer acquisition?
Every Varritech MVP engagement begins with this report. It becomes the north star document that guides discovery interviews, SRS creation, sprint planning, and go-to-market execution. Clients tell us it's the single most valuable deliverable in the entire engagement.
📞
Want a deep research report for your product idea? Book a free 30-minute strategy call and we'll walk through how the process works for your specific market and use case.
What's Next?
You now have the exact frameworks, scripts, and structures we use to take a product from "I have an idea" to "here's the signed SOW and sprint plan." But frameworks are only as good as their execution.
📞
Stuck on any of these phases? Book a free 30-minute strategy call. We'll walk through your specific situation — whether you need help with discovery research, SOW creation, project structuring, or all of the above.
No pitch. No pressure. Just two engineers talking shop.
Varritech Development Services — Bold ideas wait for no one.
🎧
🎧 Audio Guide: Listen to the Complete Walkthrough Prefer to listen? Hit play for a full narrated walkthrough of all 5 phases in this guide — from research and discovery through project delivery. Narrated by our head of Strategy.
You just read the free guide. There are six more. UI/UX systems, production architecture, security audits, testing culture, growth systems, and AI infrastructure.
 Guide 1 · Free